
Phoenix, February 8, 2026
The Phoenix housing market is adjusting to a cooling trend while benefiting from a strong regional economy. New listings have seen a decrease, but the underlying economic fundamentals remain solid, providing opportunities for buyers and sellers. A notable rise in affordable housing supply is evident, with prices in this sector declining. Despite challenges, the broader economic landscape continues to offer stability and growth, making it essential for potential buyers to understand these shifts.
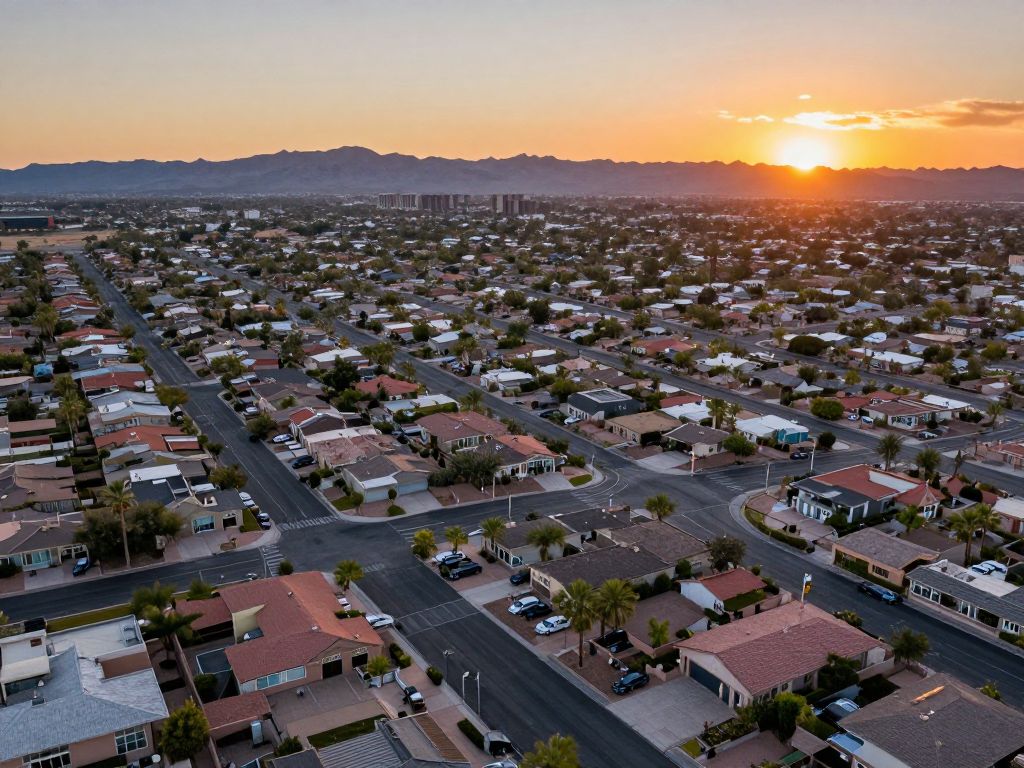
Phoenix, AZ
Phoenix Housing Market Navigates Cooler Trends Amidst Robust Economic Gains
Even as the national economy demonstrates impressive resilience and growth, the Phoenix housing market is recalibrating, offering a new landscape for buyers and sellers. This dynamic environment, characterized by both cooling residential trends and strong underlying economic fundamentals, highlights the adaptability of Phoenix AZ business and the spirit of Arizona AZ entrepreneurs.
The latest analysis reveals that while the Phoenix housing market is not performing as robustly as the rest of the nation, the broader regional economy continues to outpace national averages. This nuanced picture presents both challenges and opportunities, fostering a market where strategic decisions and innovative approaches are more important than ever. The stability of the wider economic landscape, driven by positive GDP gains, provides a solid foundation for local businesses and individuals to navigate these evolving real estate trends.
For individuals and families looking to plant roots or expand their presence in the Valley, understanding these shifts is crucial. The current conditions suggest a move towards a more balanced market, where sensible regulation and entrepreneurial drive can work in tandem to create sustainable economic growth and community prosperity.
Residential Real Estate: A Shift Towards Balance
The Phoenix housing market is experiencing a period of adjustment. In January 2026, new listings were weaker than the previous year, showing a 2.5% decrease, yet this was still stronger than the significantly weaker counts seen in January from 2020 to 2024, which were the weakest in 25 years. This indicates a gradual return to more typical seasonal patterns after several turbulent years.
A notable trend is the increased supply in the affordable housing sector. Listings under $300,000 saw a significant increase in new supply, rising 15% over the last year and making up 18% of the total supply with nearly 3,800 active listings. Sales prices in this price range have declined 2-3% from last year and continue to fall, particularly impacting condos and mobile homes in central cities like Phoenix and Mesa, and single-family homes in outlying areas such as Pinal County. This softening contrasts with the broader national market, where overall active listings increased 10.0% year over year Nationwide.
Overall active listings in the Phoenix Metro area were up 8.9% year-over-year in January 2026. The monthly rate of closed sales, however, is losing momentum compared to the previous year. In January, there were 4,854 closed transactions. The average days on market for closed sales was 92 days, with an average list-to-sale price ratio of 0.98, and an average sold price per square foot of $312. Segments under $1 million have softened roughly 2%-3%, and some mid-tier neighborhoods remain down 10%-15% from their peak values during the pandemic.
Affordability and Buyer Dynamics
The Phoenix housing market’s demand-to-supply index currently sits around 80, indicating a buyer’s market where purchasers have increased negotiation power. For the City of Phoenix specifically, areas with prices under $500,000 have transitioned into a buyer’s market. This environment encourages buyers to be more thoughtful in their decisions, especially with stable home values across Arizona. Although home values remained stable, properties spent longer on the market in 2025.
Housing affordability in Arizona has seen modest improvement over the past year. In September 2025, housing costs as a share of median household income in Phoenix decreased to 43.9%, down from 44.2% a year prior. However, the cost to rent a one-bedroom apartment in Arizona has surged to $1,301 per month, a notable increase from $1,042 in 2021. Interest rates in 2025 largely remained in the 6 percent range, which did not decline as sharply as many expected, leading some consumers to delay major housing decisions. This environment has also prompted increased seller concessions and growth in suburban markets, creating new entry points for buyers.
Strong National and State Economic Performance
In contrast to the localized cooling in the residential market, the broader economic picture is strong. Nationwide, real Gross Domestic Product (GDP) increased at an annual rate of 4.4% in the third quarter of 2025. This growth was fueled by increases in consumer spending, exports, government spending, and investment. Looking ahead, the GDPNow model estimates a real GDP growth of 4.2% for the fourth quarter of 2025 Nationwide. For the full year 2025, real GDP Nationwide is projected to grow at an annual rate of 1.9%.
Arizona’s economy has demonstrated notable strength, continuing to grow faster than the nation’s. Arizona’s Gross State Product (GSP) reached $445.0 billion in 2025, marking a 4.0% increase from 2024. Over the past five years leading up to 2025, Arizona’s GDP has grown at an annualized rate of 3.0%, ranking it 7th among all 50 U.S. states for trailing five-year GDP growth. The Phoenix Metro area’s GDP growth, while slowing slightly, still achieved a 2.2% year-over-year gain through 2025, remaining well ahead of the national rate.
Employment figures also reflect this robust economic growth. In 2025, the Phoenix Metro area’s employment reached 2.5 million, with 31,200 new jobs added over the year. While the unemployment rate saw a slight increase from 3.3% to 3.6%, it remained significantly below the Nationwide average of 4.6%. Job growth in Arizona has been driven by sectors such as private education and health services. Arizona personal income rose 3.2% over the quarter in the third quarter of 2025, slightly below the national pace of 3.3%. Year to date through the third quarter of 2025, Arizona personal income was up 4.4%, which was below the national pace of 4.9%. Population growth in Phoenix doubled the national average, though the 1.0% year-over-year increase represented a deceleration from previous quarters.
Commercial Real Estate Momentum
The commercial real estate sector in Phoenix AZ business continues to show positive momentum. January 2026 saw several significant commercial real estate transactions. Among these was the sale of the Thirty 03 office tower in Midtown Phoenix for $32.25 million. Additionally, IndiCap finalized a lease agreement with Nomaco for 77,140 square feet at the Eastmark Center of Industry. These deals underscore the sustained investment interest in the region’s commercial properties, reflecting confidence in future economic growth.
The Phoenix office market experienced positive net absorption in 2025, totaling 973,402 square feet, with 772,138 square feet occurring in the fourth quarter alone. Other reports indicate 749,729 square feet of positive net absorption in Q4 2025, and 211,540 square feet of positive direct net absorption during Q4 2025. This positive trend led to a decrease in the office vacancy rate by 100 basis points in 2025, reaching 26.5%, the lowest level since Q4 2023. Leasing activity also surged to 2.0 million square feet in Q4 2025, marking the strongest quarterly activity since Q2 2024.
The industrial market also performed strongly, recording 2.2 million square feet of positive net absorption in Q4 2025, bringing the year-to-date absorption to 15.2 million square feet, a 2.0% increase from the same period in Q4 2024. Another analysis highlights 3.3 million square feet of net absorption in Q4 2025, contributing to a yearly net of 15.9 million square feet, the third-highest in Phoenix’s history. Despite an elevated overall market vacancy of 15.3% compared to the past five years, rental rates stabilized with a 1.2% increase over 2025. These figures illustrate the ongoing private investment and development driving the Phoenix AZ business landscape.
Looking Ahead: Resilience and Opportunity
The current market conditions in Phoenix present a unique blend of cooling residential real estate and dynamic commercial activity, all underpinned by strong regional economic growth. This environment provides significant opportunities for Phoenix small business owners and Arizona AZ entrepreneurs who are agile and innovative. The ability of the market to self-correct and find new equilibria, even amidst shifting national and local pressures, is a testament to the underlying economic strength and the vibrant community spirit.
As Phoenix continues to evolve as a hub for semiconductor, healthcare, and advanced manufacturing, the foundational economic elements remain robust. The slight deceleration in residential property growth can be viewed as a healthy normalization, allowing for greater affordability and more thoughtful market participation. We encourage our readers to support local businesses, engage with community development initiatives, and stay informed about the unfolding economic narrative in Phoenix, ensuring a resilient and prosperous future for all.
Frequently Asked Questions
How is the Phoenix housing market performing in early 2026?
The Phoenix housing market is not performing as well as the rest of the nation, according to an analysis. New listings in January 2026 were weaker than last year, down 2.5%, but stronger than the 5 years from 2020-2024, which had the weakest counts in 25 years for January listings. House prices in Phoenix declined 1.4%. Segments under $1 million have softened roughly 2%-3%.
What are the latest GDP gains Nationwide?
Real Gross Domestic Product (GDP) Nationwide increased at an annual rate of 4.4% in the third quarter of 2025. The GDPNow model estimate for real GDP growth Nationwide in the fourth quarter of 2025 is 4.2%. For the full year 2025, real GDP Nationwide is expected to grow at an annual rate of 1.9%.
How does Arizona’s economic growth compare to the national average?
Arizona’s economy continues to grow faster than the nation’s. Arizona’s Gross State Product (GSP) in 2025 reached $445.0 billion, representing an increase of 4.0% from 2024. Arizona’s GDP has grown at an annualized rate of 3.0% over the five years to 2025, ranking it 7th out of all 50 US states for trailing five-year GDP growth.
What is the status of commercial real estate in Phoenix?
The Phoenix office market returned to positive net absorption in 2025, totaling 973,402 square feet, with 772,138 square feet occurring in the fourth quarter alone. The industrial market recorded 2.2 million square feet of positive net absorption in Q4 2025, bringing year-to-date absorption to 15.2 million square feet, up 2.0% from the same point in Q4 2024. The sale of the Thirty 03 office tower in Midtown Phoenix for $32.25 million was among the five biggest commercial real estate deals in Metro Phoenix in January 2026.
Has housing affordability improved in Phoenix?
Housing affordability has improved modestly in Arizona during the past year. Housing costs as a share of median household income fell to 43.9% in Phoenix in September 2025, down from 44.2% a year ago.
Key Economic and Housing Market Features
| Feature | Details | Scope |
|---|---|---|
| Phoenix Housing Market Performance (Early 2026) | Not performing as well as the rest of the nation. House prices declined 1.4%. Segments under $1 million softened 2%-3%. Demand-to-supply index around 80. | Phoenix |
| National GDP Growth (Q3 2025) | Increased at an annual rate of 4.4%. | Nationwide |
| Arizona GDP Growth (2025) | GSP reached $445.0 billion, a 4.0% increase from 2024. 3.0% annualized growth over five years to 2025, ranking 7th Nationwide. | State-level |
| Phoenix Office Market (2025) | Positive net absorption totaling 973,402 square feet. Vacancy rate decreased to 26.5% (lowest since Q4 2023). | Phoenix |
| Phoenix Industrial Market (Q4 2025) | 2.2 million square feet of positive net absorption (year-to-date 15.2 million sq. ft.). Rental rates stabilized with 1.2% increase over 2025. | Phoenix |
| Phoenix Housing Affordability (September 2025) | Housing costs as a share of median household income fell to 43.9% (down from 44.2% a year ago). | Phoenix |
| Arizona Personal Income Growth (Q3 2025) | Rose 3.2% over the quarter, slightly below the national pace of 3.3%. Year to date up 4.4%, below the national pace of 4.9%. | State-level |
| Phoenix Metro Employment (2025) | 2.5 million employment, adding 31,200 jobs. Unemployment rate 3.6% (below national average of 4.6%). | Phoenix |
Deeper Dive: News & Info About This Topic
HERE Resources
Canadian Business Leaders Explore Economic Opportunities in Surprise
Buckeye Earns National Recognition for Budget Transparency
Phoenix Business Center Fuels Local Economic Drive
The WM Phoenix Open Underway at TPC Scottsdale
Ryo Hisatsune Takes Lead at WM Phoenix Open
Phoenix Pushes for Statewide Rental Assistance Amid Housing Challenges
Buckeye’s Next Chapter: $270M Community Boosting Growth
Old Town Scottsdale’s Crown Jewel: A Glimpse into Luxury and Growth
Arizona’s Rising Industries: Opportunities Ahead
East Valley Emerges as a Premier Destination for Data Centers